PLC and system visualization for field control tasks
System Visualization
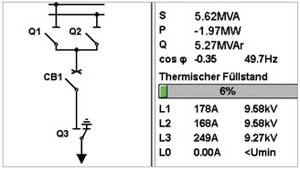
The structure of an installation and the equipment used therein can be displayed graphically. Recording the equipment status via SAVE device inputs makes it possible to create a dynamic visualization of the current status values for the actual installation. Measurements and symbols (e.g. capacitive measurement) can also be implemented.
In addition, easy-to-read text fields show the most significant measurements at a glance.
The mimic diagram and the measurement displays can be easily and conveniently configured using the DIGICOM program on a PC.
Platforms
KOMBISAVE+
POWERSAVE, only the circuit breaker can be visualized